Preliminary results
Initial testing was performed on a simple spherical geometry.
CA cells and simulation
Input geometry for CA. Blue dots represent muscle tissue, green dots correspond
to the conducting system, where the excitation propagation speed is much
higher.
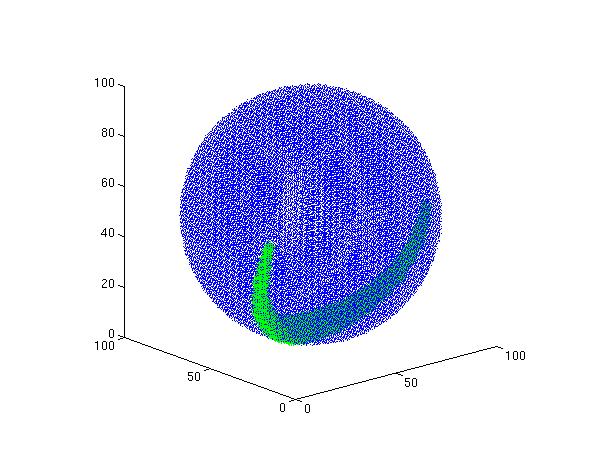
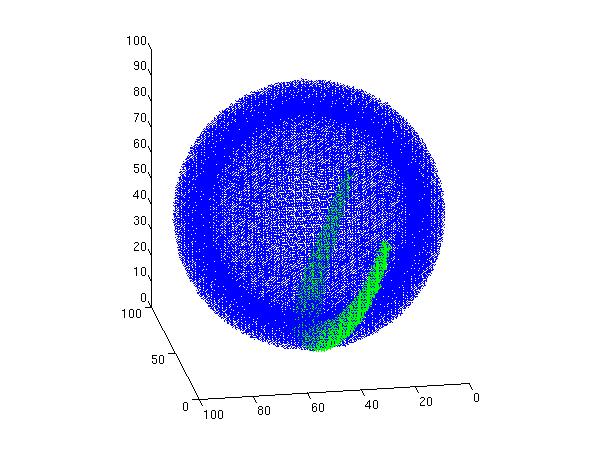
The wave starts in the middle of the conducting system and propagates to both
branches. Look at animation.
FEM simulation
All simulations used the same FE mesh. Due to symmetry, only one half of the
ball was used. Two different CA inputs served for the activation computation.
- Case A: 25x50x50 cells, half-sphere (-> border effects), 5 FE step ~ 1 CA
step.
- Case B1: 100x100x100 cells, sphere, 5 FE step ~ 1 CA step.
- Case B2: 100x100x100 cells, sphere, 1 FE step = 1 CA step.
It has been observed that the dynamic response of the structure heavily depends
on time step relations of both computations since, for the case when several
FEM time steps use one CA step, the activation changes can be rather
abrupt. The same holds for coarse cell arrays. Just look at case A animation
and compare them with those of case B1. The coarser the CA cell array, the
higher is the propagation speed relative to the structure size and hence the
activation changes in case A are faster than in case B1. Case B2 was a special
run where the step mapping was one to one. However the mesh movements are very
small in this case, because the wave propagated too fast to overcome inertial
effects.
The material consisted of a hyperelastic matrix, passive viscoelastic
(connective) fibres (PF) and active (muscle) fibres (AF), both in two
preferential directions (dir1, dir2).
Animations
Site Evolution
-
16.07.2001 This page was created.
-
19.11.2001 Introduction removed.
E-mail: cimrman3@ntc.zcu.cz