Conditional Probability & Bayes' Theorem
Interactive model of conditional probability, natural frequencies, and Bayes' rule
An interactive calculator and visual model for conditional probability and Bayes' theorem. It demonstrates the relationship between prior probability (population prevalence), test sensitivity and specificity, and the resulting posterior probability.
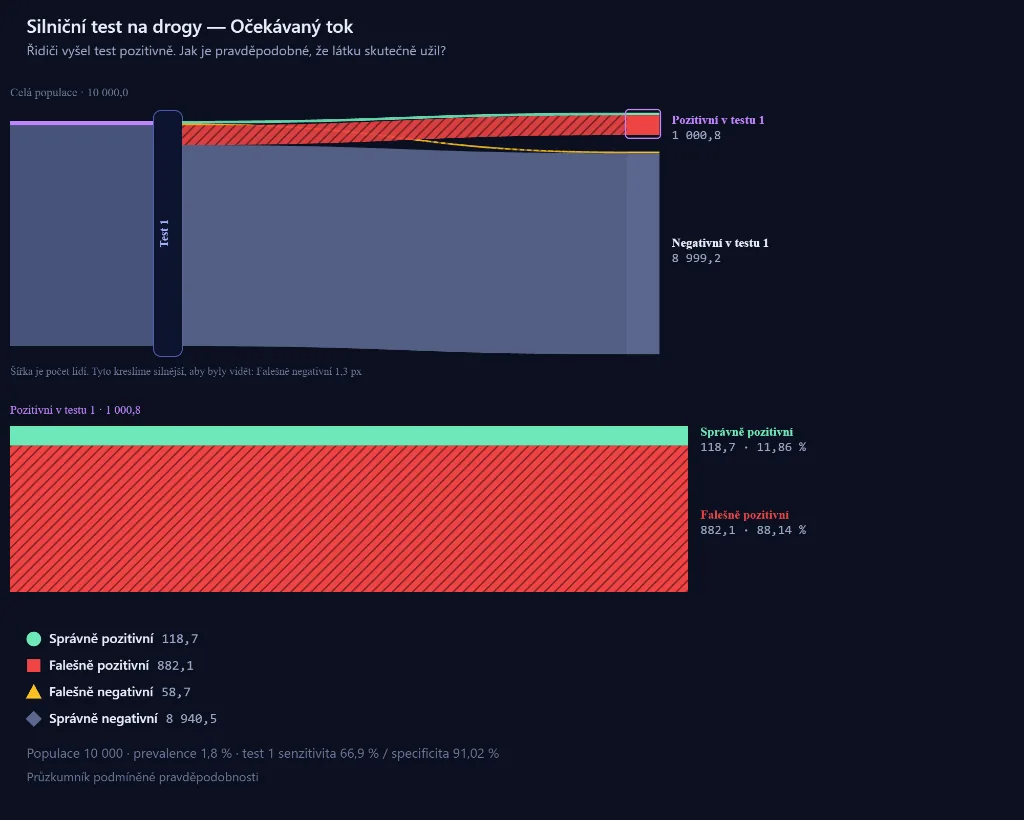
Conditional probability visualization via natural frequency tree and contingency table
Project Overview & Context
Used in probability and statistics courses to illustrate the base-rate fallacy, where observers overestimate the meaning of a positive test result when the condition's population prevalence is very low. The tool converts probabilities into natural frequencies (such as counts per 1,000 or 10,000 individuals), making the numerical relationships easier to follow.
Key Features & Capabilities
Natural Frequencies & Population Grid
Population sample visualization (1,000 to 100,000 individuals) color-coding true and false positives and negatives.
Natural Frequency Tree
Hierarchical breakdown of the population into affected and unaffected cohorts, followed by test outcomes with exact counts.
2x2 Contingency Table
Structured 2x2 contingency matrix reporting positive and negative predictive values (PPV and NPV).
Two-Stage Testing
Simulation of sequential confirmatory testing, showing how posterior probability increases after a second independent test.
Preconfigured Scenarios
Presets from clinical diagnostics, forensics, and industrial quality control (screening tests, rare diseases, alarm reliability).
Educational Value & Pedagogical Context
Learners frequently confuse conditional directions: equating P(+|D) (sensitivity) with P(D|+) (positive predictive value). This simulation visually demonstrates how a condition prevalence of 0.1% results in mostly false positives, even when test sensitivity and specificity are 99%.